
Ways to use CUMULUS
One operating picture, shaped to the work you do.
Ports, coastal towns, growers, and research programs all need the same coastal record. What changes is which part of it matters today.
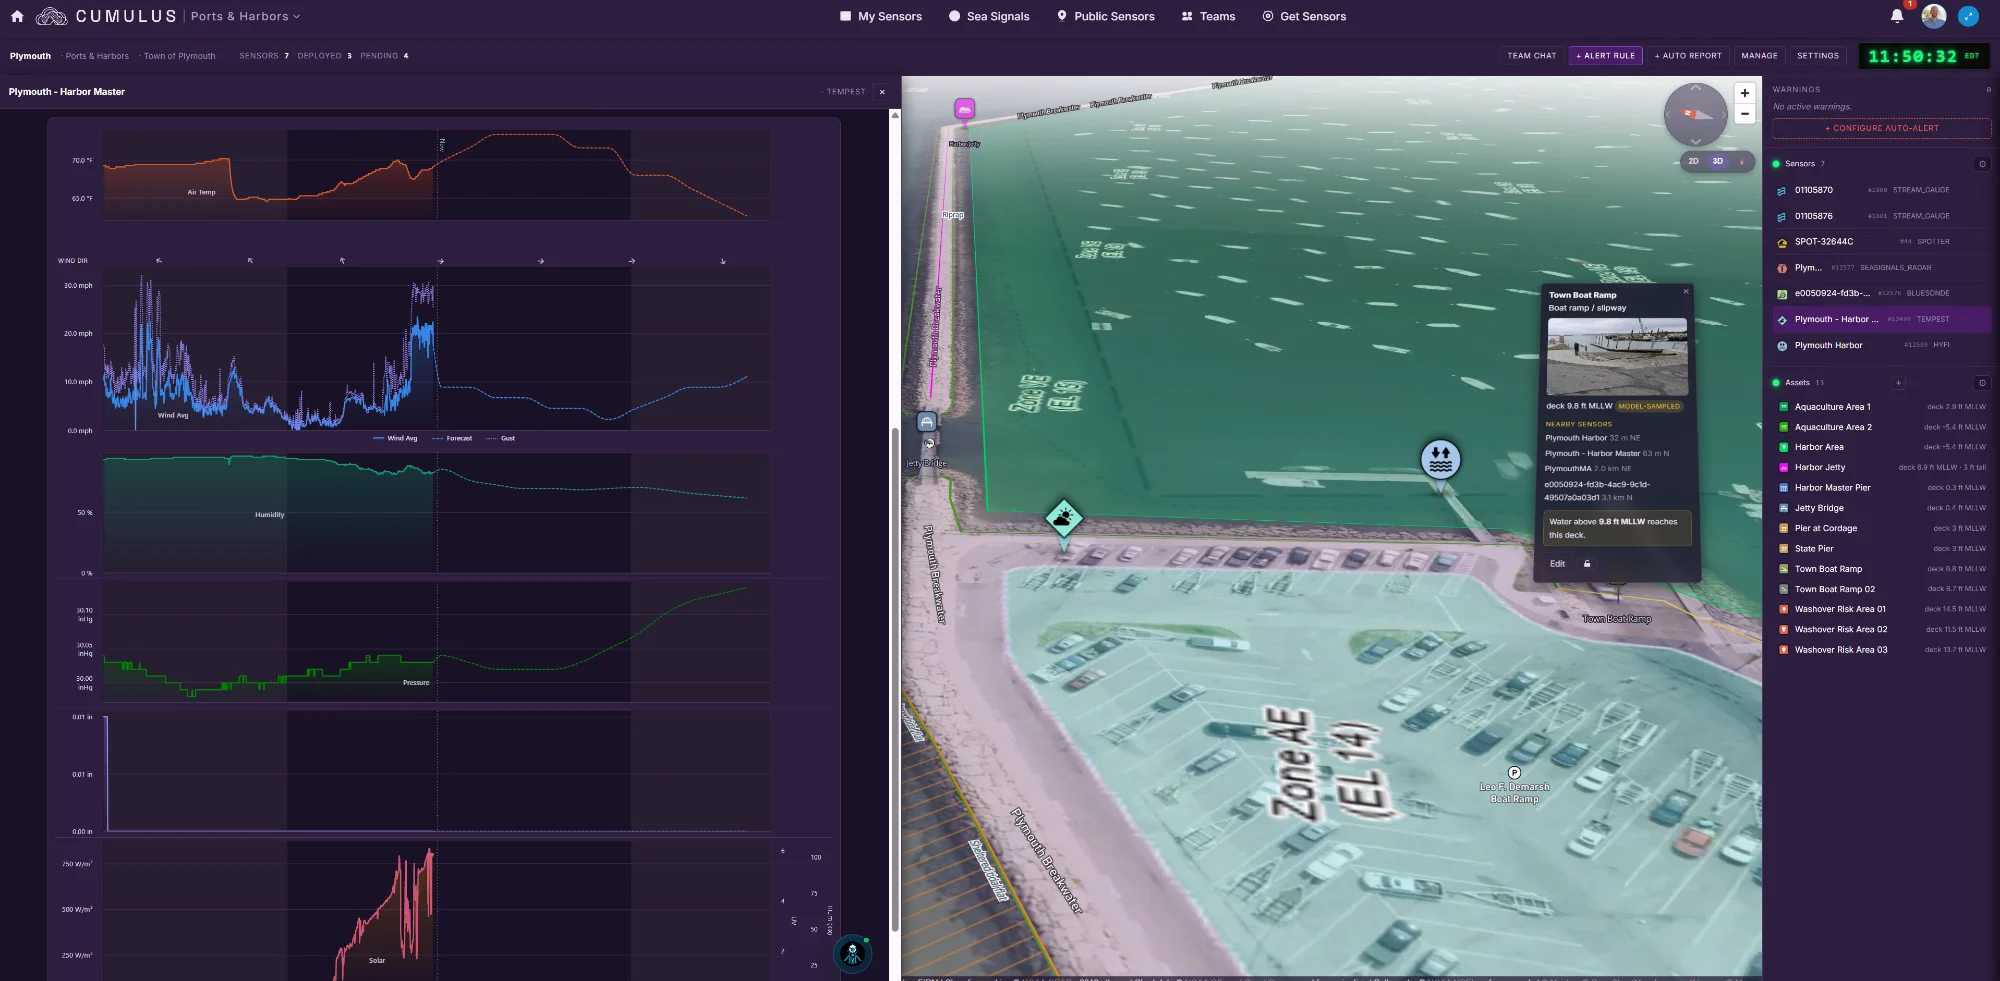
 Ports & Harbors
One operating picture for the harbor.
Harbormasters, pilots, and port operations see the same conditions at berth resolution.
- Vessel traffic, wind, water level, waves, and water quality in one view.
- Alerts when a threshold that matters to you is crossed.
- Exports and APIs that feed the systems you already run.
Coastal Resilience
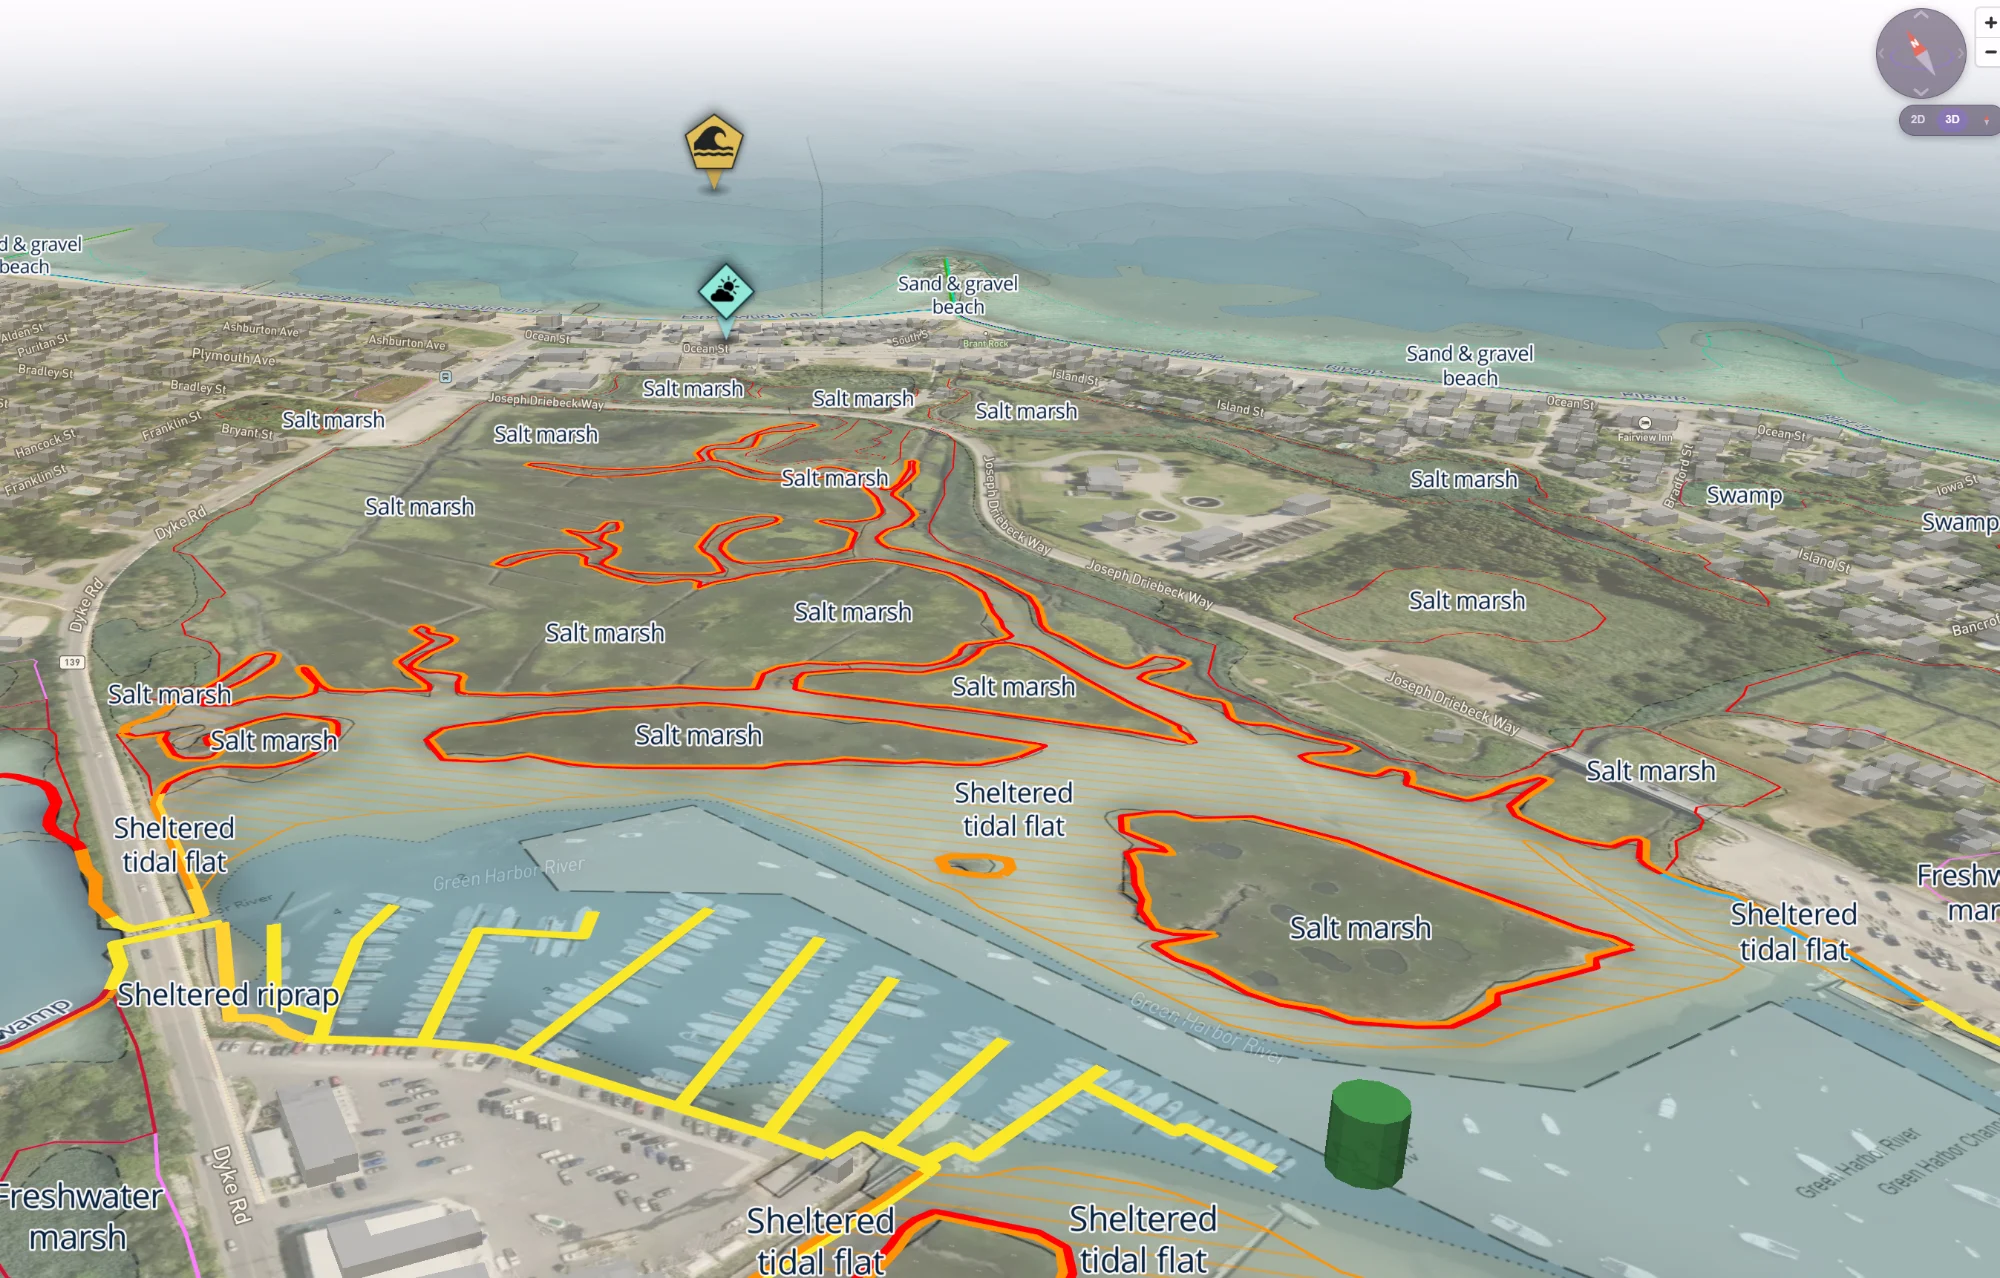
Know what floods first, and when.
Towns get an operating picture for planning on a blue-sky day and for acting on a gray one.
- Water level, waves, and overtopping tracked against the streets and seawalls you worry about.
- Automated alerts for harbormasters, DPW, and emergency management.
- A continuous record to cite in resilience plans and grant applications.
Aquaculture
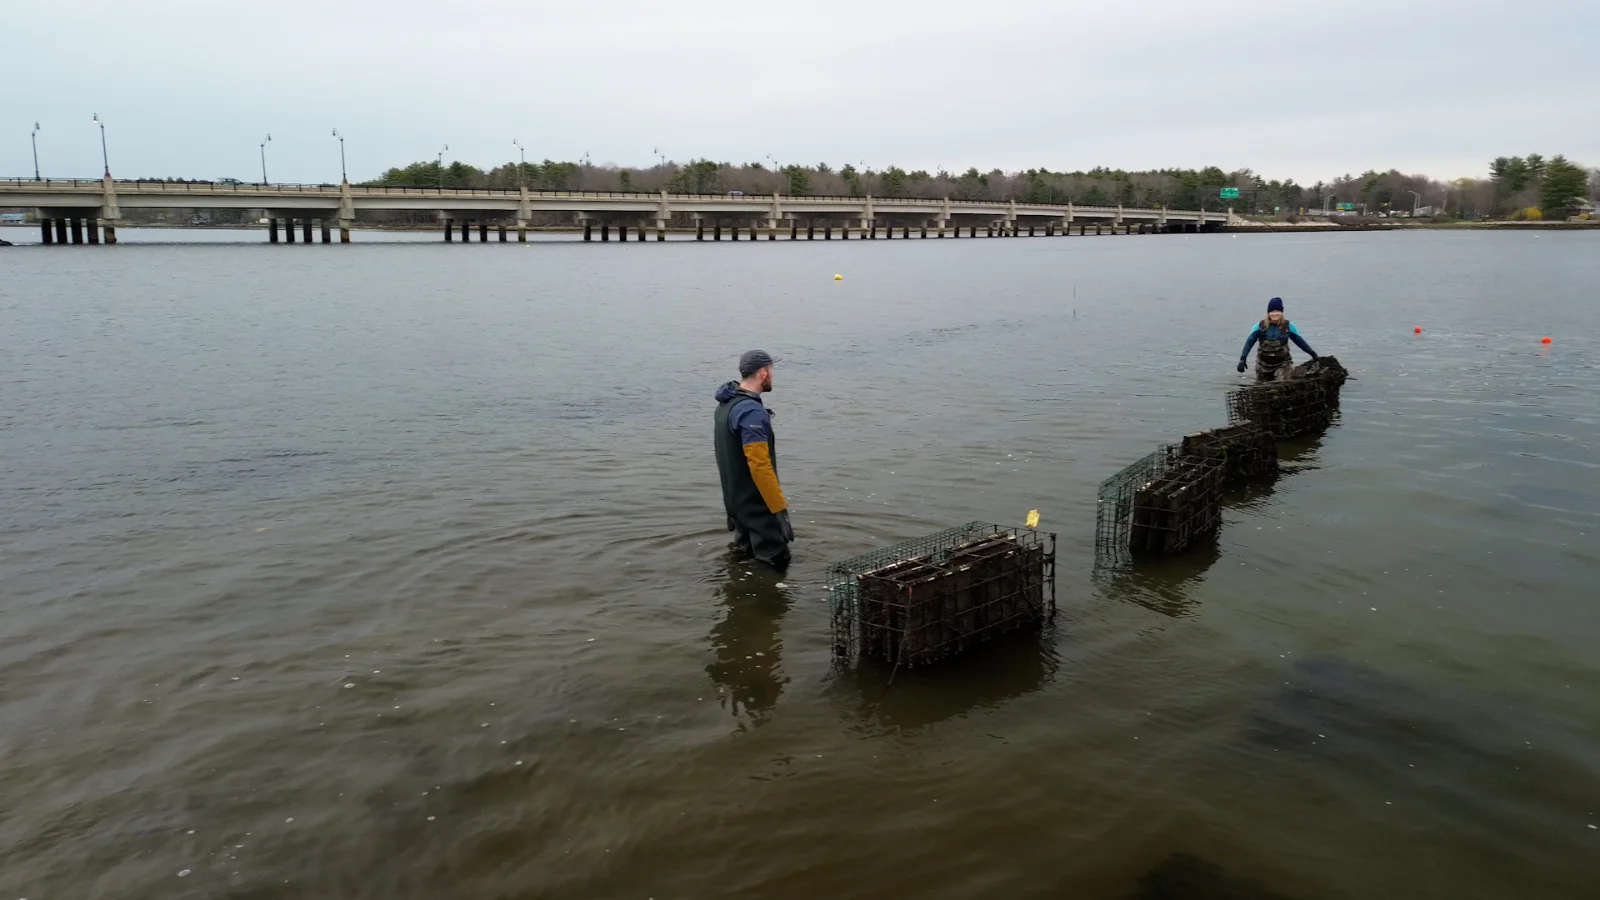
Conditions on the farm, continuously.
Growers see water quality and gear conditions without a site visit.
- Temperature, salinity, dissolved oxygen, and turbidity from your own sondes.
- Alerts when conditions move outside the range your stock tolerates.
- Records you can hand to regulators and buyers.
The measured record behind a coastal asset.
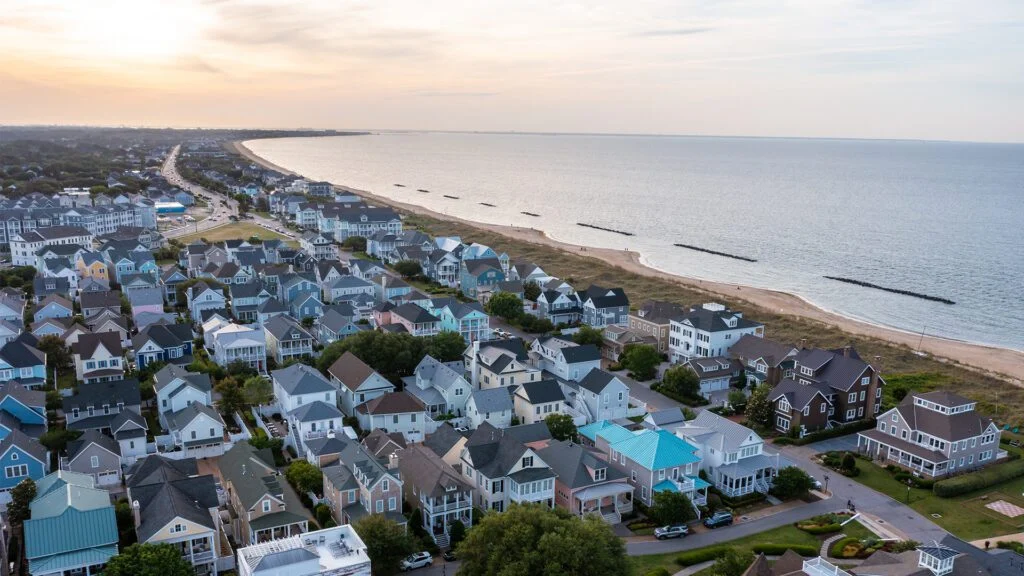
Underwriters and risk teams can get the observed water level and wave record for a site, alongside the flood zones they already use.
- Continuous water level and wave observations at the site, not a one-off survey.
- FEMA flood zones and asset elevations on one map, so a given water level shows what it reaches.
- Exports and an API for your own models.
Records you can cite. Instruments you can prove.
Traceable observations in open formats, with new sensors and prototypes streaming in alongside them on the same footing.
- Quality checks and metadata captured on arrival, with a provenance trail through to the published result.
- Download what you need, in formats that open anywhere.
- New sensor types integrate in as little as a day.
- Compare a prototype against co-located reference instruments, and keep the full raw record.
Get in touch
See your coastline in CUMULUS.
Tell us what you monitor today and where the gaps are.